September 16th 2004 started a strike followed by a lockout that would change sports forever. The National Hockey League canceled what would have been its 88th season, and put the already semi-important sport on the fringe of becoming irrelevant. The NHL became the first (and only) sport to cancel and entire season of play. All the details are interesting but not all that important. What is important is that hockey became a damaged sport. ESPN, the monopoly of national sports, decided to drop the NHL from its TV contract.
What came next was believed to be the death of the sport, but has spawned into the birth of something greater. The NHL decided to sign on with Versus (Actually the Outdoor Living Network O.L.N) for a seven year deal. They also signed local deals with Comcast sport networks and in a few markets the fox sports channel. For those seven years ESPN continued to ignore the NHL and actually increased its coverage of other sports such as Nascar and Soccer. It looks like the Versus deal panned out for both sides. The NHL has seen steady attendance increases as well as viewership over those seven years.
Most would think, so what, VS is cable only television channel, and there are less than 10 nationally televised game. The NHL wasnt stupid, it needed a new twist to attract a larger market of viewers. Besides changing the rules to allow more goals as well as to end games in a shootout instead of a draw, they started the Winter Classic. The Winter Classic is viewed on NBC, which has held the contract for the past 4 seasons. What is of greater interest is that NBC just bought Versus. Another thing to note, Comcast just bought NBC. Recall how I mentioned that the NHL has local deals with Comcast Sports Network.
The NHL contract with Versus expires shortly, and they needed a new contract with a television channel. There were a few bidders, but most notably Versus as well as ESPN made bids for the next 10 seasons. The NHL had "no regrets" with their choice of Versus, and signed up with Versus for the next 10 seasons. With a major sport under its belt, NBC,Versus and Comcast (which are all really the same), decided to test their luck and create the second 24 hour news network. This means that the monopoly of ESPN now has some competition, and they already have their foot in the door with three sports. NBC also owns the rights to the NHL, College Football (Notre Dame) and NFL (Sunday Night Football). It can get enough footage to start a decent competitor.
Now this network could flop, but what it showed was a weakness in ESPN. They did not have faith in the NHL years ago and it may come back to bite them. In the same year ESPN lost the rights to the 2014 world cup to Fox Sports (a much smaller provider). NBC sports network (pending a super cool name , maybe NBCSP or NBSPN) is at least going to have the NHL for the next 10 years and that is something to start. And it all started because of a strike, a strike that injured a sport, but rebuilt the networks it was shown on. Now only if NBC Sports can get @buster_olney to get insider information
Wednesday, December 28, 2011
Friday, December 2, 2011
BCS Standoff | Who Should Play who?
Roll Tide! I have to start this post off with that, because I am about to write about why Alabama should not play LSU in the National championship. First and foremost, I respect Alabama, and I like the team. I think it would be a stretch (and bandwagonish) of me to say I'm a fan.
One Game Thats it
Alabama played LSU, you can watch clips and read about it onwe hate hockey channel ESPN. The game went into overtime, and Alabama missed a field goals that could have won them the game. However, aren't all of lives just what ifs. Alabama lost, and thats all it takes to not play in the national championship. But not only that, but they lost to the team that is currently number 1. Lets assume that they do meet in the final game for the national championship, and Alabama beats LSU. So who is the national champion? Well LSU would be 11-1 with their only loss coming to Alabama, Alabama would be 11-1 with their only loss coming to LSU, it would be a draw in all sense. But wait, the national championship somehow means more than the regular season game. So LSU is forced to beat the same team twice, and their original win over Alabama really got them... a rematch, which for all intense and purposes got them nothing.
Facts : Oklahoma State DID NOT lose to LSU. So they should get a chance to, and if its a blow out, it just proves that LSU is such a great team.
Why the Playoff System would not solve this
EVERYONE wants a playoff system, expect for the people making millions of dollars of bowl games. So there really isn't a rush to change the current system, and thank god, because that would not fix the problem. There are (roughly including the Independents) 12 conferences. So it would take 4 games, which translate to 4 weeks of playoffs to get a national champion. That would be a lot of time, but so is March Madness. All the other teams would play bowl games a one and done, kinda like it is now. This is what most people agree would solve our problem of "The Bowl System isnt fair".
If we switched to this play-off style, LSU would not play Alabama. LSU would win thenational championship SEC Championship and then enter the bracket that way. So a #1 could actually not play the #2 for the National Championship.
Football is Football| Breathe and Realize
I think its safe to say, football is football and it causes the worst problems! It has a lot of heavy hitting, and a lot time to play out a play-off system. Teams cant really play more than once a week, which would draw out this play-off bracket system.
Power Conferences
No one talks about the Big East, but they are just slightly behind SEC for highest out-conference wins Average. The Football industry, selects teams it wants to play, and finds reasons not to place them into the national championship. What they should be doing is looking at data then deciding who to put in the rankings. To date, the "Computer Poll" still relies 25% of a teams human ranking. That is 1/4 random bias. Needless to say, LSU should not play Alabama in the National Championship.
This is a chart of The Average wins out-of-conference from the teams in the conference.

One Game Thats it
Alabama played LSU, you can watch clips and read about it on
Facts : Oklahoma State DID NOT lose to LSU. So they should get a chance to, and if its a blow out, it just proves that LSU is such a great team.
Why the Playoff System would not solve this
EVERYONE wants a playoff system, expect for the people making millions of dollars of bowl games. So there really isn't a rush to change the current system, and thank god, because that would not fix the problem. There are (roughly including the Independents) 12 conferences. So it would take 4 games, which translate to 4 weeks of playoffs to get a national champion. That would be a lot of time, but so is March Madness. All the other teams would play bowl games a one and done, kinda like it is now. This is what most people agree would solve our problem of "The Bowl System isnt fair".
If we switched to this play-off style, LSU would not play Alabama. LSU would win the
Football is Football| Breathe and Realize
I think its safe to say, football is football and it causes the worst problems! It has a lot of heavy hitting, and a lot time to play out a play-off system. Teams cant really play more than once a week, which would draw out this play-off bracket system.
Power Conferences
No one talks about the Big East, but they are just slightly behind SEC for highest out-conference wins Average. The Football industry, selects teams it wants to play, and finds reasons not to place them into the national championship. What they should be doing is looking at data then deciding who to put in the rankings. To date, the "Computer Poll" still relies 25% of a teams human ranking. That is 1/4 random bias. Needless to say, LSU should not play Alabama in the National Championship.
This is a chart of The Average wins out-of-conference from the teams in the conference.

Friday, November 25, 2011
Lockout SmockOut | The Patchstats Solution
Money pays the bills, thats why everyone wants it. Whether it is a 50/50 split, or a debate over actual revenue, the lockout has made ESPN the sports industry very upset. I can say personally that I am upset, because I am forced to do college "amateur" statistics instead. I can only imagine how bad Kyrie Irving feels after leaving Duke to go sit on the sidelines while this debate is played out.Sports fans now huddle around their TV hoping that the owners and players come together and finally realize there is no I in team, [of course unless you are Lebron James]. Below I have a few comments on the Lockout and what I think we should do instead of this "66 game season", because that's just silly, for everyone involved.
Lebron James | Success of the lockout
The lockout helped someone, and that is Lebron James. He came out of this twitter battle looking like a little kid who just wants to play the games. It took a lot of the negative attention away from him and put it on the League and [all of] the players. He really hasn't lost any fitness, and its tough when you have the build of the best player in (really recent) NBA history. He has miles to go before becoming "a statue outside my stadium" legend. Think about it though, the last year and half in the NBA was about Lebron James taking his talents outside of Cleveland to Miamia to team up with these Superstars. Then when the team got on the court they had the weight of the world on them. I think a majority of sports fans are willing to drop this talk if they bring back the NBA, of course if it actually ever does come back.
Also looking at his stats, it looks like he could have used the break. This past year (as i predicted earlier in the blog) was a statistical nightmare for Lebron, he averaged less stats per minute in every category; we would have to go back to the 2005/2006 season to match these terrible numbers. Blame the Miami nightlife, the new team or a pending lockout, but Lebron fell in the numbers, so the year off could really help his Career.
The NHL/MLS Fans go wild in excitement
The lockout forced fans to take their talents elsewhere, and for some it was to the MLS, and for others the NHL. At 9pm a bar has to put on a game, no one likes to watch infomercials at a bar, that's why we drink at home! Sure the MLS caused some controversy when their playoff system created some unjust wins. But the story is, the MLS gained some reputation this past season. Although the MLS Cup final wasn't the highest attended game in history (that was in 2002 where 61,000 people attended the match), it was a large step. More games were on ESPN this year than any other previous seasons. The NBA would have taken a lot of the MLS post-season games away; no NBA more MLS games.
The NHL can finally make it on ESPN. Granted it is not until the half-way mark, but it still sneaks its way in there. And the NHL is grabbing all the NBA fans that are just looking for a sport Monday-Friday.
The Solution.
A 66ish game season is a terrible idea. Never rush a team, never rush a player, that is how injuries occur. What I think should happen is kinda like a video game. Lets redo the draft, but with all the players. The worst team from last year gets the first pick, and gets that player for the year. They play a 50 game fake season that really is just practice. My Example would have Minnesota getting Lebron James, and then the other teams would follow. This is a redistribution of wealth approach. Let these so called "poorer" teams get a chance to drive that luxury car they always wanted to. I mean even when the draft these good players they decide to go to Europe (i.e Ricky Rubio). Have the season played out, with these forced misfits and watch the NBA grow from what it use to be. I think it would add some excitement to the league, because it wouldn't guarantee the Lakers a playoff spot and Cleveland might make the playoffs again (::sigh::).
So who pays the players? The league does, the owners will pay an ownership fee to the league, consisting of their previous year's costs in salary and the league will write the checks (just for this year) to the players.
What about a trophy? Think of this as the year without a Santa Clause. Santa isnt coming down that chimney, but we can work with what we have. Make it the "Lock-out" trophy, something that resembles those high school combination locks. To remind the League and players , that when you get greedy, your reward is some crappy trophy that middle school student could have made.
This idea seems crazy, but to a statistician so does a 66 game season. To me, playing a 66 game season is like trying to drive 82 miles an hour down a highway, and oh yea, its snowing. You are putting the players at risk, the league at risk, and trying to push a bad product down our throats because ya'll couldn't agree over pretzels or potato chips. So why dont you chalk up your losses and try something new, have this Fantasy style season, where you mix and match and get to the heart of the sport instead of the revenue.
Thanks for Reading, and have a Happy Thanksgiving!
Monday, November 21, 2011
Complain , but Stats dont see it
Since the NBA is on a lock out, ESPN has decided to go into hibernation, but I wont let that stop PatchStats. It has been a wild month, working on publications, and assisting the Saberphere on matters. However, we are back to the grind giving you a new look and reason to things.
It has been a long held belief that in sports, playing back to back games leaves a huge disadvantage for the team playing the back-to-back game. This past month I watched the Maple Leafs and Capitals both drop games on back-to-back days. The theory carries heavy in the NBA, where teams typically travel very far for one game, then off to another city for the next game. A lot of the scheduling has to do with revenue. Teams would love to get Friday,Saturday and Sunday games since they produce the highest attendance, aka Cash Money. But players cant do this, because for now, they are just humans. Disgruntled fans, and some coaches, have complained when they get a schedule with back-to-back games, as it is almost assumed the second game is a loss. However, thoughts are not numbers, and on this blog we use numbers to make conclusions.
In 2010-2011, 9 teams had a higher winning percentage on back to back games. [Canucks,Senators,Bruins,Blue Jackets,Penguins,Blackhawks,Rangers and Blues], of those 9 teams, only two of them did not make the play-offs. So most teams, had a worse winning record when playing back-to-back. However the true question is, how big is this difference, is one game, or 10, these things matter in sports. The thing is, the difference between regular season winning percentage and back-to-back games was on average only .08. Most teams only play about 1 out of every 5 games on a back-to-back schedule, the team with the highest percentage was Buffalo who played 27% of their games after a prior game.
This is your Statistician Speaking : Here is the testing done to show it has little effect
Ho : The Difference between Back-to-Back games and Regular Season Record = 0
Ha : There is some difference
T = .09/.07
T = 1.37
Thus, we conclude that there is no difference in the result of the game due to playing a game the day before.
There is some evidence, but not very strong evidence. Still, people will complain, and every loss will be because "We played the day before"

For now, keep those skates moving, because points are points.
It has been a long held belief that in sports, playing back to back games leaves a huge disadvantage for the team playing the back-to-back game. This past month I watched the Maple Leafs and Capitals both drop games on back-to-back days. The theory carries heavy in the NBA, where teams typically travel very far for one game, then off to another city for the next game. A lot of the scheduling has to do with revenue. Teams would love to get Friday,Saturday and Sunday games since they produce the highest attendance, aka Cash Money. But players cant do this, because for now, they are just humans. Disgruntled fans, and some coaches, have complained when they get a schedule with back-to-back games, as it is almost assumed the second game is a loss. However, thoughts are not numbers, and on this blog we use numbers to make conclusions.
In 2010-2011, 9 teams had a higher winning percentage on back to back games. [Canucks,Senators,Bruins,Blue Jackets,Penguins,Blackhawks,Rangers and Blues], of those 9 teams, only two of them did not make the play-offs. So most teams, had a worse winning record when playing back-to-back. However the true question is, how big is this difference, is one game, or 10, these things matter in sports. The thing is, the difference between regular season winning percentage and back-to-back games was on average only .08. Most teams only play about 1 out of every 5 games on a back-to-back schedule, the team with the highest percentage was Buffalo who played 27% of their games after a prior game.
This is your Statistician Speaking : Here is the testing done to show it has little effect
Ho : The Difference between Back-to-Back games and Regular Season Record = 0
Ha : There is some difference
T = .09/.07
T = 1.37
Thus, we conclude that there is no difference in the result of the game due to playing a game the day before.
There is some evidence, but not very strong evidence. Still, people will complain, and every loss will be because "We played the day before"
For now, keep those skates moving, because points are points.
Tuesday, October 4, 2011
Ready for some Football
There are three types of teams (vaguely) in the NFL. There are those that overchieve, those that underachieve and of course, those that just achieve.
In Statistics, we like to predict the outcomes of events. I've talked earlier in the blog about win rates and how to vaguely calculate them. Over the past 56 seasons, that formula has never been off by more than one game. So i will say, it is a pretty good estimator. So I'll go over the three types of teams below.
The Achievers : These are most the teams
Team W L
These teams do things like most teams. They either score a lot, and prevent a lot of points, or they just allow a lot of points. The St. Louis Rams have that problem. The problem is , the Rams just really cant score, and give up a ton of points. They are tied for the second most amount of points given up, while their offense has only scored 46 points. That is just over 11 point average per game. Now.. i wouldnt say they dont have hope, but what they need is offense. Sure, offense and defense are highly correlated (meaning if your offense isnt of the field, your defense is out there defending it), BUT they give up an acceptable amount of points to win a few more games. They need more offense. I would suggest adding a wide out. The Rams only have 748 passing yards putting them in 26th ; but have 370 running yards getting them 23rd. All other teams, well only if I had the time!
The Over-Achievers : Teams that win, despite us not predicting that.
Team Wins Loss
There are an array of teams here. Detriot - Not many people will complain with this one, since everyone things they are overrated and beat some "easy teams" What they have to worry about... not much actually.They have the second best offense tied with New England and the 8th best Defense. It is their defense that has expected them to lose a game. I mean, every team has to lose (well minus the 1974 Miami Dolphins). The Packers are easy to pick apart. They are terrible at defense and there isnt much hiding that, ranked 18th on points allowed.
Kansas City - is just terrible, and got lucky on their one win against the vikings.
The Under-Achievers : Teams that win, despite us not predicting that.
All of these teams should be one game higher. The Eagles have given up as many points as they have scored; and that not shockingly in their problem. Sure Vick could throw for more points and they could win games. But when your defence blows the lead they had on sunday, there is only so much you can expect from your offnese. That is what the Eagles need, an Defense. Ranks D- 23 Offense - 10. Give up less points and expect more wins. Think of this in baseball as having heavy bats, but no pitching, you'llpull a red soxs blow the season quickly.
Updates to come
In Statistics, we like to predict the outcomes of events. I've talked earlier in the blog about win rates and how to vaguely calculate them. Over the past 56 seasons, that formula has never been off by more than one game. So i will say, it is a pretty good estimator. So I'll go over the three types of teams below.
The Achievers : These are most the teams
Team W L
| Baltimore | 3 | 1 |
| Tennessee | 3 | 1 |
| Houston | 3 | 1 |
| Buffalo | 3 | 1 |
| New England | 3 | 1 |
| Washington | 3 | 1 |
| New Orleans | 3 | 1 |
| San Francisco | 3 | 1 |
| Cincinnati | 2 | 2 |
| NY Jets | 2 | 2 |
| Oakland | 2 | 2 |
| Dallas | 2 | 2 |
| Chicago | 2 | 2 |
| Pittsburgh | 2 | 2 |
| Atlanta | 2 | 2 |
| Denver | 1 | 3 |
| Seattle | 1 | 3 |
| Jacksonville | 1 | 3 |
| St. Louis | 0 | 4 |
These teams do things like most teams. They either score a lot, and prevent a lot of points, or they just allow a lot of points. The St. Louis Rams have that problem. The problem is , the Rams just really cant score, and give up a ton of points. They are tied for the second most amount of points given up, while their offense has only scored 46 points. That is just over 11 point average per game. Now.. i wouldnt say they dont have hope, but what they need is offense. Sure, offense and defense are highly correlated (meaning if your offense isnt of the field, your defense is out there defending it), BUT they give up an acceptable amount of points to win a few more games. They need more offense. I would suggest adding a wide out. The Rams only have 748 passing yards putting them in 26th ; but have 370 running yards getting them 23rd. All other teams, well only if I had the time!
The Over-Achievers : Teams that win, despite us not predicting that.
Team Wins Loss
| Detroit | 4 | 0 |
| Green Bay | 4 | 0 |
| NY Giants | 3 | 1 |
| Tampa Bay | 3 | 1 |
| San Diego | 3 | 1 |
| Cleveland | 2 | 2 |
| Kansas City | 1 | 3 |
There are an array of teams here. Detriot - Not many people will complain with this one, since everyone things they are overrated and beat some "easy teams" What they have to worry about... not much actually.They have the second best offense tied with New England and the 8th best Defense. It is their defense that has expected them to lose a game. I mean, every team has to lose (well minus the 1974 Miami Dolphins). The Packers are easy to pick apart. They are terrible at defense and there isnt much hiding that, ranked 18th on points allowed.
Kansas City - is just terrible, and got lucky on their one win against the vikings.
The Under-Achievers : Teams that win, despite us not predicting that.
| Philadelphia | 1 | 3 |
| Arizona | 1 | 3 |
| Carolina | 1 | 3 |
| Minnesota | 0 | 4 |
| Miami | 0 | 4 |
| Indianapolis | 0 | 4 |
All of these teams should be one game higher. The Eagles have given up as many points as they have scored; and that not shockingly in their problem. Sure Vick could throw for more points and they could win games. But when your defence blows the lead they had on sunday, there is only so much you can expect from your offnese. That is what the Eagles need, an Defense. Ranks D- 23 Offense - 10. Give up less points and expect more wins. Think of this in baseball as having heavy bats, but no pitching, you'll
Updates to come
Monday, September 26, 2011
America | Where the weak surprise
In America, the poor and the underdog are always the fan favourite. This really only happens in America. As the Atlanta Braves and Red Sox continue to ruin their play-off hopes it got me thinking about how American (and ESPN for that matter) it is.
In Europe, they have mixed systems. The Barclay's Premier League, La Liga and the Bundesliga League all work on a "best" record system. Meaning, the team that ends the season with the most amount of points wins the league. Sure, it becomes less exciting when teams like Manchester United sweep the league and just crush their way to the top. But that is the World's way. The team that fought all year, shouldn't be suppressed to have to prove they are the best in some random series at the end of the year.
The World and It's Argument :
Formula 1, European Football, Golf and Rugby all have this style of awarding a winner. The team at the end of the season with the most points wins the League. While I was in England, I would discuss with the English about this. They always had solid arguments for this method. Think about if Aaron Rodgers got a concussion the last week of the season, and lets say the team had the most amount of points. Is it fair that the packers, who clearly showed they were the best should not be awarded the Super Bowl. The argument works really well in baseball where the sample size of games in much larger (162). The Phillies who are likely to go to the World Series should at least be given a direct path there. Instead, their very successful season will be tested unnecessarily against some random events. Randomness could kill a season, where the Phillies who have less likely Randomly got the most amount of points.
But this is America, and we love hope:
That is right, this is America, and like our founding, we want the small dog to overcome the evil empire [The British]. We want the Phillies to be upset by the struggling Braves, or to have the Tamp Bay Rays win on the final day of the season and make their way to the World Series where they win for the small town that barely has actual fans. This is something greater than sports!
Wild Card Sucess:
MLB : 3-World Series Won 8-World Series Appearances [Since 1981]
NFL : 5 - Super Bowls Won 9-Super Bowl Appearances [Since 1970]
The NHL and the NBA (assuming it isnt locked out forever) do not have wildcards per say. Instead, 8 teams from the league make the playoffs. Then they continue to play 7 game series for 4 series, making the playoffsboring long. 8/15 teams make the playoffs in both leagues, thats more than 50% of the league. It almost makes one wonder why a team would try for so long. A good example of this is the Washington Capitals. They get a lot of heat for being in the southeastern division, one of the weaker divisions, but continue to produce 100+ point seasons, quite the impressive feat. However, they haven't been to a Stanley Cup in years, in fact its been since 1998., yet they finished first in the league 4 years in a row. Shouldn't they be rewarded for this?
What Does Australia have anything to do with this?
The Australians may be up to something here. A friend of mine brought this up to me when were discussing this exact topic. In Australian, the better teams do have an advantage in the playoff structure. The first round works a lot like the American Structure. 1vs8 2vs7 3vs6 4vs5 : Standard. But what is interesting is the second round. All winning teams advance, but the two teams with the higher seed get a bye week, and the two teams with the lower seed of the losing side are eliminated. So for example, lets say the winners are 8,2,6,4 thus the losers are 1,7,3,5. So 2,4 would get the bye week, while 1 and 3 would get another chance to win. They are being rewarded somewhat for their season long success, but still have to win some important games.
Baseball :
If baseball does add teams to its post season play, i would like to see them try this system. It would be unique. I would like to see good teams be rewarded for having a season long of success, instead of losing to a fluke home-run, or having a pitcher injured for a game.
In Europe, they have mixed systems. The Barclay's Premier League, La Liga and the Bundesliga League all work on a "best" record system. Meaning, the team that ends the season with the most amount of points wins the league. Sure, it becomes less exciting when teams like Manchester United sweep the league and just crush their way to the top. But that is the World's way. The team that fought all year, shouldn't be suppressed to have to prove they are the best in some random series at the end of the year.
The World and It's Argument :
Formula 1, European Football, Golf and Rugby all have this style of awarding a winner. The team at the end of the season with the most points wins the League. While I was in England, I would discuss with the English about this. They always had solid arguments for this method. Think about if Aaron Rodgers got a concussion the last week of the season, and lets say the team had the most amount of points. Is it fair that the packers, who clearly showed they were the best should not be awarded the Super Bowl. The argument works really well in baseball where the sample size of games in much larger (162). The Phillies who are likely to go to the World Series should at least be given a direct path there. Instead, their very successful season will be tested unnecessarily against some random events. Randomness could kill a season, where the Phillies who have less likely Randomly got the most amount of points.
But this is America, and we love hope:
That is right, this is America, and like our founding, we want the small dog to overcome the evil empire [The British]. We want the Phillies to be upset by the struggling Braves, or to have the Tamp Bay Rays win on the final day of the season and make their way to the World Series where they win for the small town that barely has actual fans. This is something greater than sports!
Wild Card Sucess:
MLB : 3-World Series Won 8-World Series Appearances [Since 1981]
NFL : 5 - Super Bowls Won 9-Super Bowl Appearances [Since 1970]
The NHL and the NBA (assuming it isnt locked out forever) do not have wildcards per say. Instead, 8 teams from the league make the playoffs. Then they continue to play 7 game series for 4 series, making the playoffs
What Does Australia have anything to do with this?
The Australians may be up to something here. A friend of mine brought this up to me when were discussing this exact topic. In Australian, the better teams do have an advantage in the playoff structure. The first round works a lot like the American Structure. 1vs8 2vs7 3vs6 4vs5 : Standard. But what is interesting is the second round. All winning teams advance, but the two teams with the higher seed get a bye week, and the two teams with the lower seed of the losing side are eliminated. So for example, lets say the winners are 8,2,6,4 thus the losers are 1,7,3,5. So 2,4 would get the bye week, while 1 and 3 would get another chance to win. They are being rewarded somewhat for their season long success, but still have to win some important games.
Baseball :
If baseball does add teams to its post season play, i would like to see them try this system. It would be unique. I would like to see good teams be rewarded for having a season long of success, instead of losing to a fluke home-run, or having a pitcher injured for a game.
Tuesday, September 6, 2011
Expected Win Ratio: New Statistic
Baseball is a game of numbers, but aren't most sports. Bill James invented a metric called the Pythagorean Expectation. It derives its explanation from the Pythagorean Theorem. What the equation says is, if we take how many runs a team scores, square it, then divide that number by how many runs a team scored squared plus how many runs a team gave up (squared) we will get that team's winning (or losing) percentage.
So all in all it looks a little like this [Runs for]^2/([Runs for]^2+[Runs Against]^2).
Or more neatly

Now sabermetricans have perfected the equation, and realized that actual exponent should be around 1.86. There are many sabermetric articles about how well this is at calibrating the win expectation of a baseball team. Some teams are really good at beating the odds, meaning they win more games than their expected wins. In 2011,The San Francisco Gaints are the best team at this, they have won 6 more games than their expected winning percentage would say. Now all of this has been examined, so what does this really mean, why I am blogging about this. That is because, what if we borrowed this idea for other sports. Could we predict the winning percentage of your favorite football team?
Using a similar equation, but with Points For and Points against, allow us to start :
[Points for]^2/ ([Points For]^2 + [Points against]^2) .
Now if we optimize the Standard Error equation, being [Expected Winning - Actual winning]^2 . Our goal is to make the sum of those numbers the lowest, by adjusting the Expected winning number. And of course, the only thing that isnt constant is the exponent value. So if we optimize that, we should aquire the value of 2.50 .
So using the last 51 years of NFL data, a teams overall record can be determined by using the above equation.

This is a plot of all the data. As we would expect, it is very close to a straight line. That means that, our Estimated winning percentage is very close (in error) to the Actual winning percentage. There are a few minor flaws. The projection will rarely give a 0-16 season, but teams actually do that. But as you can see, the projection only predicted they would win 10% of their games, so still a small margin.
So what, why does this matter you may ask. How does this equation effect anything. It actually means a lot As I continue to examine predictors and estimates, we now can value a teams outcome. If we can predict (with in a certain error) a team's Points For, and a team's Points Against, we could predict how many games the team is going to win that season.
Now if we can use points to get wins, we could other stats to get points. How many points is a particular position responsible for, so if we add Quarterback B, who is expected to throw X amount of yards, we can contribute his X yards to Y wins. Almost in a linear fashion. So as I continue to expand the Football statistics I will refer to this expected winning ratio.
So all in all it looks a little like this [Runs for]^2/([Runs for]^2+[Runs Against]^2).
Or more neatly
Now sabermetricans have perfected the equation, and realized that actual exponent should be around 1.86. There are many sabermetric articles about how well this is at calibrating the win expectation of a baseball team. Some teams are really good at beating the odds, meaning they win more games than their expected wins. In 2011,The San Francisco Gaints are the best team at this, they have won 6 more games than their expected winning percentage would say. Now all of this has been examined, so what does this really mean, why I am blogging about this. That is because, what if we borrowed this idea for other sports. Could we predict the winning percentage of your favorite football team?
Using a similar equation, but with Points For and Points against, allow us to start :
[Points for]^2/ ([Points For]^2 + [Points against]^2) .
Now if we optimize the Standard Error equation, being [Expected Winning - Actual winning]^2 . Our goal is to make the sum of those numbers the lowest, by adjusting the Expected winning number. And of course, the only thing that isnt constant is the exponent value. So if we optimize that, we should aquire the value of 2.50 .
So using the last 51 years of NFL data, a teams overall record can be determined by using the above equation.

This is a plot of all the data. As we would expect, it is very close to a straight line. That means that, our Estimated winning percentage is very close (in error) to the Actual winning percentage. There are a few minor flaws. The projection will rarely give a 0-16 season, but teams actually do that. But as you can see, the projection only predicted they would win 10% of their games, so still a small margin.
So what, why does this matter you may ask. How does this equation effect anything. It actually means a lot As I continue to examine predictors and estimates, we now can value a teams outcome. If we can predict (with in a certain error) a team's Points For, and a team's Points Against, we could predict how many games the team is going to win that season.
Now if we can use points to get wins, we could other stats to get points. How many points is a particular position responsible for, so if we add Quarterback B, who is expected to throw X amount of yards, we can contribute his X yards to Y wins. Almost in a linear fashion. So as I continue to expand the Football statistics I will refer to this expected winning ratio.
Friday, August 26, 2011
Free Market Failures : Sort of
I, like most humans, get bored from time to time. I get bored writing columns about sports, I get bored watching particular television shows or reading news columns. Then every once in a while, a little spark stimulates my mind and that boredom goes away. For me, that spark was Top Gear. As I watched these nutjobs guys ride across Africa in their £1500 cars, I honestly thought, if this can be done with higher taxes please raise mine. Then it got me thinking, does the free market fail us. Please note future news broadcasters, this is my political waiver. This has nothing to honestly do with politics or whether or not a free market is good or not. That is up for colleges and or the New York Times to debate. I will simply express my opinions on things that are free markets in themselves, and why they have failed us.
Top Gear:
Top Gear is produced by the British Broadcasting Corporation, as many know it as the BBC. The BBC is funded by this fee applied to all British residence with a television. There are different rates such as black and white or colour.Now whether you watch the television or not, you still have to pay the annual tax. So this funds shows like Top Gear, the Inbetweeners and the Weakest Link. The Americans have recently copied this programme with one on theworld war II History channel. Now the budget for the British show must be massive, because they buy all these cars and then trash them. The show is such a hit that when they travel the world they are often greeted by some political ambassador. The show is now on for its 9th year and 17th (series, the British ones are smaller than our regular season).
So what does this great show have anything to do with Free Markets. Well, the BBC is far from a free market. Shows are given money from the British tax payers and are rarely dependent on rankings. The advertisement sure adds some, but the BBC still funds the show. It was also born as a concept not in a Free Market. Shows are allowed to fail for a lot longer on the BBC before they are taken off. In America's Free Market television we have the reverse effect! We have shows on that cost very little and are shoved down our throat.
Why you should be angry
Of the top 10 shows in America by rating, only two are written, and its actually the same show twice!(NCIS). American Idol, The Voice, and the NFL all come in front of Modern Family, How I Met Your Mother and The Office. American's are watching the cheapest shows! How is this possible? Well lets assume that a tv channel is a Business (unlike the BBC). In order to raise profits you need to do two things, 1 get more customers(which is somewhat already capped) or lower costs. The TV companies have lowered cost by getting rid of writers (or in our Top Gear case, giving a lot of money to blow things up). Even MTV has bought into this. This is truly why you should be angry. The Jersey Shore has more reasons (the fifth one is finishing production) than Arrested Development! Sure what my blog is saying is that if we had the BBC, Arrested Development would still be around. But the sad part is, the Jersey Shore is unlikely to go away soon. People watch a bunch of drunk idiots get in fights. How much does that cost? It costs one really good film editor and few lawyers to fight off potential lawsuits. Anyone with a home camcorder could do this [disclaimer:: do not attempt]. Other than that, it costs MTV nothing! Think about all the money they are saving from props, to filming time to actors to writers and all the things that go into quality television. The advertising pushes us to shows like this, the TV companies like to save money. The BBC on the other hand, would rather send a bunch of blokes to America to race cars, who cares how much it cost!
Sports:
I read a great article over at grantland (linked here) by Malcolmn Gladwell that said sports are not a Business.Despite me agreeing, they do have a market and it is free. This is another free market that is failing us.
Baseball : I don't think I say this enough on this blog. I hate the Yankees, here, I'll say it again, I hate the Yankees.However, the Yankee's do not hate their Free Market. The Yankees have been to the World Series 40 times, more than any other team in history. They have won26 27 World Series, again more than any other team. The Yankees have been to double the amount of World Series than the second place team (the LA Dodgers) and have won nearly there times more than the second place team (St.Louis Cardinals).They have spent more money than any other team.So sure we cant blame them for spending all that cash because they do get wins. Now not too long ago, the MLB decided to have some profit sharing, where teams like the Yankees, the Red Soxs and the Phillies would pay a lot of money to beat up on the poor teams. Think of it this way, its like building your neighbour a house, to only watch it burn to the ground so your house is the nicest looking on the block. Baseball is partially a free market. Teams share profits, and there is a draft system so that some teams can pick good players for sucking for so long. However, as Ron Swanson once said, Capitalism separates the rich from the stupid. But in sports, we dont want that. To me, and I believe most sports fan, the fun of going to a game is that any team can win! On a day to day basis, over 162 games, sure any team can win any day. But not every team really has the chance of making the play-offs. There has been a recent argument going around sports, that a team has to suck (and be poor) for 10 years in order to make a run at a championship for two years. Then of course their players will be bought off of Free Agency. That is probably where free markets fail! A team is given a lot of sucky players for losing its good player because it wasnt rich enough to buy the good player. And a poor team, cant risk signing a long term contract because if the player is a bust, they lost a good portion of money. Sure sabermetrics helped the A's ... for a while. Since the book Moneyball(Micheal Lewis 2003) came out, the A's have only made the playoffs once, losing to the Twins in a straight sweep.That is the thing about Free Markets, once your intellectual intelligence leaves you, the teams that can afford it, buy it. Before starting the season, without even playing a game, the Yankees had a 11/2 odds of winning the World Series. When sports are predictable, the season is not as fun.
Top Gear:
Top Gear is produced by the British Broadcasting Corporation, as many know it as the BBC. The BBC is funded by this fee applied to all British residence with a television. There are different rates such as black and white or colour.Now whether you watch the television or not, you still have to pay the annual tax. So this funds shows like Top Gear, the Inbetweeners and the Weakest Link. The Americans have recently copied this programme with one on the
So what does this great show have anything to do with Free Markets. Well, the BBC is far from a free market. Shows are given money from the British tax payers and are rarely dependent on rankings. The advertisement sure adds some, but the BBC still funds the show. It was also born as a concept not in a Free Market. Shows are allowed to fail for a lot longer on the BBC before they are taken off. In America's Free Market television we have the reverse effect! We have shows on that cost very little and are shoved down our throat.
Why you should be angry
Of the top 10 shows in America by rating, only two are written, and its actually the same show twice!(NCIS). American Idol, The Voice, and the NFL all come in front of Modern Family, How I Met Your Mother and The Office. American's are watching the cheapest shows! How is this possible? Well lets assume that a tv channel is a Business (unlike the BBC). In order to raise profits you need to do two things, 1 get more customers(which is somewhat already capped) or lower costs. The TV companies have lowered cost by getting rid of writers (or in our Top Gear case, giving a lot of money to blow things up). Even MTV has bought into this. This is truly why you should be angry. The Jersey Shore has more reasons (the fifth one is finishing production) than Arrested Development! Sure what my blog is saying is that if we had the BBC, Arrested Development would still be around. But the sad part is, the Jersey Shore is unlikely to go away soon. People watch a bunch of drunk idiots get in fights. How much does that cost? It costs one really good film editor and few lawyers to fight off potential lawsuits. Anyone with a home camcorder could do this [disclaimer:: do not attempt]. Other than that, it costs MTV nothing! Think about all the money they are saving from props, to filming time to actors to writers and all the things that go into quality television. The advertising pushes us to shows like this, the TV companies like to save money. The BBC on the other hand, would rather send a bunch of blokes to America to race cars, who cares how much it cost!
Sports:
I read a great article over at grantland (linked here) by Malcolmn Gladwell that said sports are not a Business.Despite me agreeing, they do have a market and it is free. This is another free market that is failing us.
Baseball : I don't think I say this enough on this blog. I hate the Yankees, here, I'll say it again, I hate the Yankees.However, the Yankee's do not hate their Free Market. The Yankees have been to the World Series 40 times, more than any other team in history. They have won
Wednesday, August 24, 2011
Gaps in statistics : NFL
People always tell us, ::insert sport:: is a team sport. My biggest arguement is, why are the statistics individual, and why do you draft a player for fantasy and not the team. A team sure has a "portion" of sucess, but come on, we are humans we can calculate that addition and remove it! However, as I continue my quest to give every player a particular metric, I get stuck at certain parts. I have listed a few of them below.
Missed Field Goals:
A touchdown is simple, a team scores 7 points and that is the end of it. If they fail, no one is really at fault. The better question is, who is to blame for a missed field goal. Is it the kicker? Well sure if the ball is on the goal line and the kick is missed than naturally it is the kickers fault. This of course, assuming the ball is snapped properly the wind is normal and the weather is without snowfall/rain. So given normal conditions we expect an NFL kicker to kick from a range. A dome, well throw out all the previous remarks because we assume they will be able to make a kick from any reasonable distance. What is reasonable though? The Average Longest kick is 53 yards. And the Average kick distance is 36.3 yards. Now lets set 36.3 yards as a threshold. We would assume that an NFL kicker would be able to score from that range. Now lets assume the ball is at the 37 yard line, and the coach calls for a field goal. The kicker shanks the ball left. Here in lies the question, whose fault is it? In sports we always blame the person at hand. Why dont we blame the Quarterback/offense. Maybe those few extra yards would have allowed the kicker to get a better kick, more breathing space. Is it the coaches fault, he should have known that the kicker was in his average range. That nothing is promised, and maybe they should have known that.
my thoughts : Now given all of the nfl drive/statistics, it is shown that the expected score depends on yards to go. 6.5 - (.081235)*(Yardstogo) = Expected Points. Now we want to know when it is better to go for it rather than to kick a field goal. So we set our expected points to 3 and reverse solve. This leaves us with 46 yards. An average kicker can make a 46 yard field goal. Thus it should be a quarerbacks second goal (obviously the first to score a touchdown) to get his team safely to the 46 yard line. Now with more research we can calculate field conditions such as rain, wind and snow. There is most likely an Expected Points for any weather condition. So I propose to use the method above until a weather additive model is created. On the otherhand, a Quarterback should be given the portion he is responsible for divided by the total * 3. REGARDLESS of if the kicker actually makes the kick (assuming it is withing the 46 yardline). This will eliminate any errors caused by the kicker.
Sacks or Interceptions:
When I always watch a game at my local watering hole, i always hear "WHY DID YOU GET SACKED". That is normally in the direction of the quarterback. I take sacks differently. I applaud the sack! What the quarterback did was realize that a fumble or interception is worse than a sack. Sure a thrown away ball is better than a sack, but without an intended receiver it becomes tricky. Possession is like gold in football. It is the ultimate prize, and losing it turns the game quickly. Not only did you go from being able to score, you now have to prevent the other team from scoring. As in Moneyball (Micheal Lewis 2003), outs came at a premium and so does possession in football. It is ok to lose a down as long as you keep possession. Sacks should be treated as a lost of yards rather than a "Sack". The sack is really the offensive line's fault. This is two fold in my "I haven't played a game of football in my life" mind. This is because not only did the offensive line not provide him enough time (even if it is a long time) they didnt give the Quarterback another option. They didnt give the quarterback a running hole, or even break the tackles so that he could throw it away. The sack should rarely be considered the fault of the Quarterback. The only time it should be considered is if a better outcome (being a throw away) is possible.
Wednesday, August 17, 2011
New Statistic : Quarterback Value
Quarterback Rating (Passer Rating)
This statistic was created in 1971 by Don Smith, and is often quoted by a lot of football enthusiast. My favorite part is, most people don’t know how to calculate it. If you know how to calculate the passer rating than you surely are in the minority.


A perfect passer rating in the NFL is 158.3. the highest ever recorded within a season is 121.4 by Peyton Manning.
Now although I normally hate bad statistics, I’m willing to keep this around until something better comes along.
Pseudo-sabermetricans came a long and created the EPA (or expected points added). There isn’t a full definition of how this is created, or is it really explained. But if I ever figure it out I’ll be sure to comment on it.
Quarterback Value (QV)
This is a statistic I roughly created the other day. However, the data doesn’t present its self to show you a cool neat graph, instead it will be a hypothetical statistic until I get some more data or find a source of this information. There are three sections of this statistic. 1. Gained Points, and credits towards those 2.Expected Points loss. 3. Expected Score of Opponent
1. Gained Points
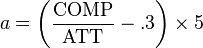
GP = 6 * [Passing Yards + Running yards that he ran - PTyards / Total Yards Gained]*[1 if TD] + 3*[% of Passing Yards]*[1 if within the NFL average Field Goal range for that stadium] + 6*[% of Running Yards in which he ran]*[1 if TD]
There are a few things to note here, I’ll work the equation from left to right. The 6 points is for the touchdown, if a team scores a touchdown, they get six, and it should be independent of the extra point attempt. The quarterback should be awarded the percentage of that in which he is solely responsible for, the passing yards. He should be given Points for driving down the field, and having a running back run the ball in. It was part of the quarterback that got the team down the field with his % of passing yards on that drive. The same applies to the third part of this equation, the Running Yards in which he ran. Some Quarterbacks are just at good at running the ball as throwing it, and they should be rewarded for that (well minus the injury risk). So they get the percent they helped the team make it down the field.
Now PT yards are penalty yards, a Quarterback should be penalized for actually committing a penalty. If he is bailed out by a running back, he should be awarded more than his share. So if he is given a penalty for Intentional Grounding, False Start or Delay of Game, than that should be subtracted from his total yards, because he put his team is danger, and forced them to have a harder time to score.
2. Expected Points Loss [EPL]
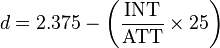
EPL = 6*[The times the team has scored 6 points / All the Times they were at this situation] + 3[The times the team has scored 3 / All the times they were at this situation] + 0 [ The times they didn’t score / all the times they were at this situation].
This is the true addition to this metric. The Expected Points Loss accounts for turnovers. I was watching a pre-season game when I thought, not all Interceptions and fumbles are created equal. There are two parts to a turnover, this portion of the statistic deals with the loss the quarterback inflicted on his team. This really works off of odds. Almost a “What would have happened if the Quarterback didn’t turn over the ball” Think about this as being 1st and goal, and the Quarterback throws an interception. Everyone this surely they would have scored had he not done that.
This is clearly a declining statistic. The farther you are away from your end zone, the less likely you are going to score, thus your team didn’t really lose that much from your turn over besides field position which in accounted for by the other half of this statistic.
3. Expected Score of Opponent [ESO]
ESO = 6*[The Probability of the other team scoring a touchdown]+3*[The Probability of the other team scoring a field goal]+6[If returned for touchdown].
Mistakes have consequences, and some mistakes are worse than others. The quarterback who fumbles the ball on his goal line, hands the ball over in the red zone, which the statistics are higher than if say he fumbled the ball at the opponents 1 yard line, where they would have to travel the length of the field to score. If the fumble or interception leads to a direct score, the quarterback should be penalized the full portion of the score.
Examples : (And Fake Numbers) |
This Game is where I will get some of the statistics
http://espn.go.com/nfl/boxscore?gameId=310206009
A rough estimate for the NFL’s expected points per yard is a negative slope of
Expected Points = 6.5 - .08125*Yards.
So allow us to begin.
The first scoring / turnover drive was with the Packers
Rodgers threw for 79% of the yards, so his + value will be 4.78
Ben Roethlisberger on the other hand threw an interception that was returned for a touchdown, so his – value would be -6
On his next Drive Roethlisberger drove the field either by running or passing and was involved for 100% of the drive, giving him +3 for the field goal. Updated score -3.
Unfortunately, he threw an interception, giving the packers the ball with 53 yards to go, costing him an opponent score of -2.45 bringing him back down to -5.45
Rodgers’s next drive he threw for 41/53 of the yards, gaining him 4.61 and moving his total points to 9.42
Roethlisberger then threw for 90% and earned a 5.37+ bringing him to .07
Roethlisberger then ran for 50% of the drive, giving him 3 points, and a total +2.93
Rodgers threw/ran for 81% of the next drive to get him 4.90 bringing him to 14.32
Roethlisberger then ran for 100% of the drive, giving him 6 points, and a total +8.93
Rodgers threw/ran for 80% of the next drive to get him 2.40 bringing him to +16.72
Thus by the end of the Game, Roethlisberger’s score was +8.93 and Rodgers was +16.72
Quarterback Value (QV)
This is a statistic I roughly created the other day. However, the data doesn’t present its self to show you a cool neat graph, instead it will be a hypothetical statistic until I get some more data or find a source of this information. There are three sections of this statistic. 1. Gained Points, and credits towards those 2.Expected Points loss. 3. Expected Score of Opponent
1. Gained Points
GP = 6 * [Passing Yards + Running yards that he ran - PTyards / Total Yards Gained]*[1 if TD] + 3*[% of Passing Yards]*[1 if within the NFL average Field Goal range for that stadium] + 6*[% of Running Yards in which he ran]*[1 if TD]
There are a few things to note here, I’ll work the equation from left to right. The 6 points is for the touchdown, if a team scores a touchdown, they get six, and it should be independent of the extra point attempt. The quarterback should be awarded the percentage of that in which he is solely responsible for, the passing yards. He should be given Points for driving down the field, and having a running back run the ball in. It was part of the quarterback that got the team down the field with his % of passing yards on that drive. The same applies to the third part of this equation, the Running Yards in which he ran. Some Quarterbacks are just at good at running the ball as throwing it, and they should be rewarded for that (well minus the injury risk). So they get the percent they helped the team make it down the field.
Now PT yards are penalty yards, a Quarterback should be penalized for actually committing a penalty. If he is bailed out by a running back, he should be awarded more than his share. So if he is given a penalty for Intentional Grounding, False Start or Delay of Game, than that should be subtracted from his total yards, because he put his team is danger, and forced them to have a harder time to score.
2. Expected Points Loss [EPL]
EPL = 6*[The times the team has scored 6 points / All the Times they were at this situation] + 3[The times the team has scored 3 / All the times they were at this situation] + 0 [ The times they didn’t score / all the times they were at this situation].
This is the true addition to this metric. The Expected Points Loss accounts for turnovers. I was watching a pre-season game when I thought, not all Interceptions and fumbles are created equal. There are two parts to a turnover, this portion of the statistic deals with the loss the quarterback inflicted on his team. This really works off of odds. Almost a “What would have happened if the Quarterback didn’t turn over the ball” Think about this as being 1st and goal, and the Quarterback throws an interception. Everyone this surely they would have scored had he not done that.
This is clearly a declining statistic. The farther you are away from your end zone, the less likely you are going to score, thus your team didn’t really lose that much from your turn over besides field position which in accounted for by the other half of this statistic.
3. Expected Score of Opponent [ESO]
ESO = 6*[The Probability of the other team scoring a touchdown]+3*[The Probability of the other team scoring a field goal]+6[If returned for touchdown].
Mistakes have consequences, and some mistakes are worse than others. The quarterback who fumbles the ball on his goal line, hands the ball over in the red zone, which the statistics are higher than if say he fumbled the ball at the opponents 1 yard line, where they would have to travel the length of the field to score. If the fumble or interception leads to a direct score, the quarterback should be penalized the full portion of the score.
Examples : (And Fake Numbers) |
This Game is where I will get some of the statistics
http://espn.go.com/nfl/boxscore?gameId=310206009
A rough estimate for the NFL’s expected points per yard is a negative slope of
Expected Points = 6.5 - .08125*Yards.
So allow us to begin.
The first scoring / turnover drive was with the Packers
Rodgers threw for 79% of the yards, so his + value will be 4.78
Ben Roethlisberger on the other hand threw an interception that was returned for a touchdown, so his – value would be -6
On his next Drive Roethlisberger drove the field either by running or passing and was involved for 100% of the drive, giving him +3 for the field goal. Updated score -3.
Unfortunately, he threw an interception, giving the packers the ball with 53 yards to go, costing him an opponent score of -2.45 bringing him back down to -5.45
Rodgers’s next drive he threw for 41/53 of the yards, gaining him 4.61 and moving his total points to 9.42
Roethlisberger then threw for 90% and earned a 5.37+ bringing him to .07
Roethlisberger then ran for 50% of the drive, giving him 3 points, and a total +2.93
Rodgers threw/ran for 81% of the next drive to get him 4.90 bringing him to 14.32
Roethlisberger then ran for 100% of the drive, giving him 6 points, and a total +8.93
Rodgers threw/ran for 80% of the next drive to get him 2.40 bringing him to +16.72
Thus by the end of the Game, Roethlisberger’s score was +8.93 and Rodgers was +16.72
The previous week, Mark Sanchez scored a +6.6
The expected opponents points was only used once because he ball was only turned over once, but you can see that if you are Mark Sanchez or Carson Palmer, your score would be much. Lower.
The expected opponents points was only used once because he ball was only turned over once, but you can see that if you are Mark Sanchez or Carson Palmer, your score would be much. Lower.
Friday, August 12, 2011
Broken Statistics : The Yards
I am in the works of creating some new edge statistics that take a look at a Quarterback's rating on the field. Sure the offensive line has a large part to do with the Quarterback's performance, along with the running back. However, the Quarterback often receives more credit than he deserves. That brings me to the broken statistic, Yards.
A Quarterback oftentosses guns the ball to a wide receiver who somehow catches the ball and runs down the field. Now the Quarterback is given the Yards statistic if the player catches the ball and continues to run. The statistic is really inaccurate. The Quarterback is not helping the wide receiver run down the field, but is given the credit as though he did. Now there are two sides to this argument. One is that the Quarterback looks for the best option when passing the ball. He looks for the best receiver that will cash him out the most amount of yards, and thus selects the most profitable receiver. Think about it this way, a Quarterback selects a stock (hopefully not in this economy) and hopes that it pays off more money(yards) than he paid for it(yards thrown). The findings are actually really cool. You can predict how many yards a quarter will receive by his receivers alone. With that, you can can see which Quarterback is the most profitable. Now the statistics are somewhat granulated, because there is no way to find out which yards a receiver caught with a particular Quarterback, but one can do this on the team level. A graph below demonstrates the teams Profit Rates.
Profit Rate = (Total Yards -Yards After Catch)/(Total Yards).

So what does this Patchstat - Profit Rate mean. What it calculates is really two things. The first is how many yards is the Quarterback actually throwing the ball, the raw value of yards. The second is how much is he being rewarded for choosing that particular receiver. A higher profit rate means two things, #1 the quarterback is smart and choosing the receiver that will get him a lot more yards, #2 is that the receivers are helping the Quarterback get more yards. Since a lot of what the Quarterback is doing depends on the receiver, you cant put full responsibility on the Quarterback, but you can make an assessment of how he chooses his receivers. Dallas had the lowest profit rate! Meaning the Cowboys do not earn additional yards after the throw. And New England had the highest, see the chart below.
All in All, the Quarterback gets a lot of "free" yards, and this will hopefully give us a better understanding of a Quarterbacks's ability.
And just for the Record, Michael Vick has a profit rate of 54%, which means he doesn't always pick the most profitable receiver.
A Quarterback often
Profit Rate = (Total Yards -Yards After Catch)/(Total Yards).

So what does this Patchstat - Profit Rate mean. What it calculates is really two things. The first is how many yards is the Quarterback actually throwing the ball, the raw value of yards. The second is how much is he being rewarded for choosing that particular receiver. A higher profit rate means two things, #1 the quarterback is smart and choosing the receiver that will get him a lot more yards, #2 is that the receivers are helping the Quarterback get more yards. Since a lot of what the Quarterback is doing depends on the receiver, you cant put full responsibility on the Quarterback, but you can make an assessment of how he chooses his receivers. Dallas had the lowest profit rate! Meaning the Cowboys do not earn additional yards after the throw. And New England had the highest, see the chart below.
All in All, the Quarterback gets a lot of "free" yards, and this will hopefully give us a better understanding of a Quarterbacks's ability.
And just for the Record, Michael Vick has a profit rate of 54%, which means he doesn't always pick the most profitable receiver.
| Team | Rate |
| DAL | 46% |
| STL | 47% |
| OAK | 47% |
| DET | 48% |
| SF | 50% |
| CAR | 51% |
| KC | 51% |
| JAC | 51% |
| SD | 52% |
| GB | 52% |
| WSH | 53% |
| HOU | 54% |
| BUF | 54% |
| PHI | 54% |
| MIN | 54% |
| CHI | 54% |
| TB | 54% |
| BAL | 55% |
| CLE | 58% |
| NO | 58% |
| CIN | 58% |
| DEN | 59% |
| IND | 59% |
| NYJ | 60% |
| NYG | 60% |
| PIT | 61% |
| MIA | 61% |
| SEA | 62% |
| ATL | 64% |
| TEN | 67% |
| ARI | 68% |
| NE | 68% |
Monday, August 8, 2011
Why I hate European Football, and not why you think.
I HATE European football, and probably for all the wrong reasons. European football is one of the least stat-minded games. It is not because statistics are not present in the game, in fact the sport has an abundance of statistics, the problem is no one truly cares about them. Europeans believe that football is truly a team sport and statistics are useless. I argue the opposite, the only problem is, well... there arent records to demonstrate why statistics are important. Now by my previous statement, I imply their are hidden statistics in the game, but no team (or sports site) is recording this data. Below I break-down why this dumb, and some statistics I would suggest adding to the sport.
Money
The average English Premier League player makes £1,670,000 ($2,733,000.00). Think about making an investment that large and not looking into their performance.There are few companies that are willing to invest that kind of money based on "looks" rather than a statistically backed evidence. Most teams and scouts in modern sports quantify something about a player, because in the information age, we want data, not words. There isn't an EPL combine, or a Players skill test. The lost money is a shame to be honest. I am almost certain that you could walk into Liverpool,Chelsea,Man U and ask why is [insert expensive player] paid that much? Almost surely will they respond, his [unquantifiable] results on the pitch.

Stat-line
Before Sabermetricans, the baseball statistics had some logical use. The batting average (despite its emptiness) still made sense, if player X bats 100 times, we would expect him to hit 33 times. Here is the stat line for an average football player (imagine if they made soccer cards like they made baseball cards)
SH = Shot Total
SG = Shots on Goal
G = Goals
OF = Offsides
FD = Fouls Drawn
FC = Fouls Committed
SV = Saves
YC = Yellow Cards
RC = Red Cards
A seven year old- watching the game could have come up with those statistics. Come on people, we have advanced beyond that! Here is an average hockey stat-line (with sabermetric-esc stats)
GP = Games Played
G = Goals
A = Assist
PTS = Points
GC = Goals Created
+/- = Plus Minus
PIM = Penalties in Minute
EV = Even Strength Goals
PP = Power Play Goals
SH = Short Handed Goals
GW = Game Winning Goal
S = Shots
S% = Shooting Percentage
TOI = Time on Ice
ATOI = Average Time on Ice
OPS = Offensive Points Shared
DPS = Defensive Points Shared
PS = Points Shared
Now these are just the basic free statistics. Here would be just a few i would add to the stat-line of an average football player
TOP = Time on Pitch
P% = Passing Percentage
GA = Give Aways
TK = Take Aways
TOOS = Time on Opponents Side (Mainly for defenders)
BA = Breakaways
S% = Shooting Percentage
+/- = Plus Minus
FS = Forced Shots - A defensive player that forces a player to make a bad shot by angling them away from the goal
PG[E] = Penalties Given [Earned] - The earned portion is for a good reason, i.e a handball with five minutes left in and empty net aka. Luis Suarez's Handball
SP% = Set Play percentage. Now i admit, this is probably one of the weakest statistics, but it is a start. It is the percentage of set-plays where a team had the favouring result. As in it reached a member of his team, or a goal is scored.
ST% = Slide Tackle Percentage (Tackles won/ Total Slide Tackles)
T% = Tackle percentage (Tackles Won/ Tackles Taken)
Why I'm so mad:
The Reason it bugs me is that it appears as though no one cares! Not a single person states reasons why Fernando Torress has suffered over the past year. People use these Qualitative things like, He doesn't have form, he "lost his step". What does that even mean, sure i lose a step from time to time, but sadly I am not costing a team £50 million. No one mentions his Fouls Drawn have increased, showing a slower more desperate player, also his OF have increased over the past three seasons because he cant get his timing right. The biggest thing is his TOP,TOOS and shooting percentage are all down. This is what separates Soccer from really the rest of (American Sports). All major American team sports have some form of minors, whether its MLB, NFL (College),NBA (College),NHL(College/AHL). This hurts soccer. They have the "Reserves, or the Academy", but rarely do players advance from them. They rather pay a lot of money for a player that is "looking" good currently. Without statistics one can not project how well a person is going to do. Besides thinking that Fernando Torres was going to implode, we have little evidence to predict it.
Statistics are driven by data, and without data its tough to gauge what will occur. So for now, and probably for quite some time, there will be overpaid football players who look good, or lost their step, but one day a small Queens Park Rangers, or Bolton will find that group of players who learn to take a walk, or pass at a good ration. Until that day, I will continue to hate European football, and im sure they would say , it was for all the wrong reasons.
Tuesday, July 26, 2011
Debt Ceiling Speech : In Numbers
This isnt about politics, it really never is. This is about words and numbers, and what a speech looks like. I did an earlier segment about The State of the Union and the length of the words. It is something that really means nothing, but an interesting analysis anyway.
7/25 Speech
Facts:
Length (in minutes) 14:44
Length (in words) : 2289
Rate : 153.6 words per minute
Longest Word : 14 letters twice | infrastructure responsibility
Most Common Word [of substance*] : Approach used 15 times.
Average Word Length : 4.667
Median Word Length : 4 characters
Mentioned the Republicans 9 times , Democrats twice


*of substance refers to a word no included in this list ( the to and a of we that in on is For have our But I).
Wednesday, July 20, 2011
Why The DMV Sucks
Recently I have switched abodes, in the fine District of Columbia. For most of you, you're probably unaware of how the parking works in this dungeon city. There are 8 zones, and within your registered zone, you can park as long as you want [given its not street cleaning day] in your particular zone. I was zone 4, but have recently upgraded moved to zone 1. However, with that, I need a new Parking Pass. I paid, did all my DMV work, and my licence came, but not my new parking pass. So I called the DMV to ask them where it was. Now in comes the statistics.
The phone system at all DMV's i am assured is terrible, lucky for me, i only had to deal with one of them. But DC is a clever little bunch, they dont allow you to "skip" sections of the call.
The Stages of a DMV call.
1. A useless note from the Mayor's Office
47 seconds . Then press 2 (for the DMV)
2. A useless note from the DMV
25 seconds . Then press 1 (for English). Which had me thinking, what if I spoke Spanish, the first minute and 2 seconds would be VERY confusing for me.
3. Another useless note from the DMV
35 seconds
Recap : Before i could begin to make selections, I had to wait 1 minute and 47 seconds.
Selections for a Registration Card (for parking)
4. 45 seconds for Information about how to apply for a Registration card.
5. 20 seconds about how you can do this on-line
6. 30 seconds about how you will need to get a new licience
7. 50 seconds about what a Customer service rep can handle
8. 30 seconds with a number you can call to pay tickets
9. FINALLY 10 seconds, and you get to customer representative.
Add all that up (and graph it below), you get 5 minutes before you can even get on hold to speak to someone. In that amount of time, I can toast a bagel, make 5 bags of minute rice, grab a coffee or avoid all that and talk to a person. There really should be a number, a more direct one that gets me to a human, that not only has emotions (now that i think about, DMV workers dont have emotions), or can get my logic.

Of course, that is 5 minutes assuming you clicked everything correct, sadly for me, that wasnt the case. I missed a few buttons here and there and needed 4 calls. To be fair, their menus are pretty confusing, since you cant just press 0 (just an FYI hitting zero restarts that stage, so dont do that).
The true kicker to this, was how much the DMV hates American Express. In the scenario i listed above, I was told of the DMV's credit card policy 5 times they take Visa, MasterCard and Discover, but they make a note to tell you "The DC DMV does NOT accept American Express"!
All in All I honestly believe the DMV tries to suck time and life out of their customers.
Monday, July 18, 2011
Harry Potter : The Franchise
Harry Potter has begun its final decent into the Hollywood Hall of Fame. Assuming it doesn't pull a Brett Favre and come out of retirement 3 times, one can assume that Harry Potter and The Deathly Hollows Part 2 is the final film to this saga. Not only did the film touch endless numbers of children and adults; it also merged great stars while forming new ones. Just think about the Lottery that Daniel Radcliffe, Emma Watson and Rubert Grint (thats Ron Weasley if you didn't know) hit when they were drafted for this film. Not just with money, as i am sure there was a lot of that, but just their pictures sitting on millions of desktops, and all over the walls of readers. This blog though is about numbers (or rather statistics), and anyone can read US Weekly (just for the record, that is not a credible source of information) if they wanted to know how the Harry Potter Characters were going to live. As I sat through the final (touching have you) moments of the final film, I realized my childhood was over. I'll try to breakdown some cool facts and figures, as well a give respect to how well the franchise did.
I am a Harry Potter Fan and it cost me :
If you just read the books, and bought them
Now : $43 Soft Cover , $114 Hardcover
At List Value Day of Release : $230
If you just watched the films once :
$95 [ fees, buy in advance options] [8 films mind you]
If you just bought the films
$175 [Sorcerers stone through Deathly Hollows Part I]
If you love harry Potter, and maxed out the above, you spent $500 dollars on Harry Potter, that is an average of $35 dollars per year.
Movies - Sure no Oscars, Golden Globes, but money talks.
This past weekend Deathly Hollows became the number 1 Opening Box Office film by $10,138,517. Just for perspective, when #2 past #3, it only did it by $6,000,000. The Deathly Hollows Part II is on pace to become the highest grossing movie of all time.
Based on Opening weekend ALONE, Harry Potter DH 2 goes down as the 168th highest grossing movie of all time. That is, if the movie never sold another ticket, and only showed on 4 days, it is 168th of ALL TIME!
Its more than the finale though,sure once you are hooked on Harry Potter, its a like a drug you can put down.
 Every Harry Potter Movie (minus Deathly Hollows Part 2) is in the top 75 of all time sales. Think about that, thats like saying the 7 out of the top 75 (all time) baseball players came from the same team. The trick here is that there were seven movies. Although the franchise is successful, it still has its faults.
Below is the series combined total. Think of this as Golf, the lower the number the better.
Spiderman[9,14,19] = 42
Lord Of The Rings [13,17,28]= 58
IronMan [25,29] = 54
StarWars [4,12,30] = 46
Pirates of the Caribbean [8,31,34] = 73
Best Three Harry Potters[26,36,39] = 101
So although the Harry Potter movies have grossed a lot of movie, and began a legacy, it did so with a consistent stream, not a Babe Ruth All-Star.That is the key about this series, it bought us for the long term. It convinced us to keep going through 10 years, that this was something worth waiting for. Most of the movies in that list above came out within 5 years of each other, we didnt have to wait long for the ending.
If Harry Potter wants to become the best franchise movies, it needs Deathly Hollows Part II to do well, and just not good, but excellent. It needs to become the Avatar of 2011; despite the 3d technology i dont think it will do it. It has $591,957,625 more to go, which seems like a lot, but the movie isnt closing tomorrow (well hopefully anyway).
The irony of Harry Potter, people wait in line until 12am on the night before to be the first to watch this movie. The top five films (grossing all time) did not have people waiting in line. People didn't wait in line for Avatar, they didn't have someone scout out seats 4 hours before hand. In fact, Avatar's opening weekend was half that of Deathly Hollows Part II and Part I; but movie box offices are not a sprint, they are marathon. Harry Potter probably wont convince people to go back several times, or will its amazing 3d images convince critics that needs to win an award (despite being a rip of a movie called Ferngully).
Despite the statistics, the movie is amazing, and it has surely touched more hearts than any Statistician could count, it made people lose hours of sleep reading those books, or millions of costume sales and lighting bolt tattoos.
I am a Harry Potter Fan and it cost me :
If you just read the books, and bought them
Now : $43 Soft Cover , $114 Hardcover
At List Value Day of Release : $230
If you just watched the films once :
$95 [ fees, buy in advance options] [8 films mind you]
If you just bought the films
$175 [Sorcerers stone through Deathly Hollows Part I]
If you love harry Potter, and maxed out the above, you spent $500 dollars on Harry Potter, that is an average of $35 dollars per year.
Movies - Sure no Oscars, Golden Globes, but money talks.
This past weekend Deathly Hollows became the number 1 Opening Box Office film by $10,138,517. Just for perspective, when #2 past #3, it only did it by $6,000,000. The Deathly Hollows Part II is on pace to become the highest grossing movie of all time.
Based on Opening weekend ALONE, Harry Potter DH 2 goes down as the 168th highest grossing movie of all time. That is, if the movie never sold another ticket, and only showed on 4 days, it is 168th of ALL TIME!
Its more than the finale though,sure once you are hooked on Harry Potter, its a like a drug you can put down.

Below is the series combined total. Think of this as Golf, the lower the number the better.
Spiderman[9,14,19] = 42
Lord Of The Rings [13,17,28]= 58
IronMan [25,29] = 54
StarWars [4,12,30] = 46
Pirates of the Caribbean [8,31,34] = 73
Best Three Harry Potters[26,36,39] = 101
So although the Harry Potter movies have grossed a lot of movie, and began a legacy, it did so with a consistent stream, not a Babe Ruth All-Star.That is the key about this series, it bought us for the long term. It convinced us to keep going through 10 years, that this was something worth waiting for. Most of the movies in that list above came out within 5 years of each other, we didnt have to wait long for the ending.
If Harry Potter wants to become the best franchise movies, it needs Deathly Hollows Part II to do well, and just not good, but excellent. It needs to become the Avatar of 2011; despite the 3d technology i dont think it will do it. It has $591,957,625 more to go, which seems like a lot, but the movie isnt closing tomorrow (well hopefully anyway).
The irony of Harry Potter, people wait in line until 12am on the night before to be the first to watch this movie. The top five films (grossing all time) did not have people waiting in line. People didn't wait in line for Avatar, they didn't have someone scout out seats 4 hours before hand. In fact, Avatar's opening weekend was half that of Deathly Hollows Part II and Part I; but movie box offices are not a sprint, they are marathon. Harry Potter probably wont convince people to go back several times, or will its amazing 3d images convince critics that needs to win an award (despite being a rip of a movie called Ferngully).
Despite the statistics, the movie is amazing, and it has surely touched more hearts than any Statistician could count, it made people lose hours of sleep reading those books, or millions of costume sales and lighting bolt tattoos.
Subscribe to:
Posts (Atom)