People always tell us, ::insert sport:: is a team sport. My biggest arguement is, why are the statistics individual, and why do you draft a player for fantasy and not the team. A team sure has a "portion" of sucess, but come on, we are humans we can calculate that addition and remove it! However, as I continue my quest to give every player a particular metric, I get stuck at certain parts. I have listed a few of them below.
Missed Field Goals:
A touchdown is simple, a team scores 7 points and that is the end of it. If they fail, no one is really at fault. The better question is, who is to blame for a missed field goal. Is it the kicker? Well sure if the ball is on the goal line and the kick is missed than naturally it is the kickers fault. This of course, assuming the ball is snapped properly the wind is normal and the weather is without snowfall/rain. So given normal conditions we expect an NFL kicker to kick from a range. A dome, well throw out all the previous remarks because we assume they will be able to make a kick from any reasonable distance. What is reasonable though? The Average Longest kick is 53 yards. And the Average kick distance is 36.3 yards. Now lets set 36.3 yards as a threshold. We would assume that an NFL kicker would be able to score from that range. Now lets assume the ball is at the 37 yard line, and the coach calls for a field goal. The kicker shanks the ball left. Here in lies the question, whose fault is it? In sports we always blame the person at hand. Why dont we blame the Quarterback/offense. Maybe those few extra yards would have allowed the kicker to get a better kick, more breathing space. Is it the coaches fault, he should have known that the kicker was in his average range. That nothing is promised, and maybe they should have known that.
my thoughts : Now given all of the nfl drive/statistics, it is shown that the expected score depends on yards to go. 6.5 - (.081235)*(Yardstogo) = Expected Points. Now we want to know when it is better to go for it rather than to kick a field goal. So we set our expected points to 3 and reverse solve. This leaves us with 46 yards. An average kicker can make a 46 yard field goal. Thus it should be a quarerbacks second goal (obviously the first to score a touchdown) to get his team safely to the 46 yard line. Now with more research we can calculate field conditions such as rain, wind and snow. There is most likely an Expected Points for any weather condition. So I propose to use the method above until a weather additive model is created. On the otherhand, a Quarterback should be given the portion he is responsible for divided by the total * 3. REGARDLESS of if the kicker actually makes the kick (assuming it is withing the 46 yardline). This will eliminate any errors caused by the kicker.
Sacks or Interceptions:
When I always watch a game at my local watering hole, i always hear "WHY DID YOU GET SACKED". That is normally in the direction of the quarterback. I take sacks differently. I applaud the sack! What the quarterback did was realize that a fumble or interception is worse than a sack. Sure a thrown away ball is better than a sack, but without an intended receiver it becomes tricky. Possession is like gold in football. It is the ultimate prize, and losing it turns the game quickly. Not only did you go from being able to score, you now have to prevent the other team from scoring. As in Moneyball (Micheal Lewis 2003), outs came at a premium and so does possession in football. It is ok to lose a down as long as you keep possession. Sacks should be treated as a lost of yards rather than a "Sack". The sack is really the offensive line's fault. This is two fold in my "I haven't played a game of football in my life" mind. This is because not only did the offensive line not provide him enough time (even if it is a long time) they didnt give the Quarterback another option. They didnt give the quarterback a running hole, or even break the tackles so that he could throw it away. The sack should rarely be considered the fault of the Quarterback. The only time it should be considered is if a better outcome (being a throw away) is possible.
Showing posts with label sabermetrics. Show all posts
Showing posts with label sabermetrics. Show all posts
Wednesday, August 24, 2011
Wednesday, August 17, 2011
New Statistic : Quarterback Value
Quarterback Rating (Passer Rating)
This statistic was created in 1971 by Don Smith, and is often quoted by a lot of football enthusiast. My favorite part is, most people don’t know how to calculate it. If you know how to calculate the passer rating than you surely are in the minority.


A perfect passer rating in the NFL is 158.3. the highest ever recorded within a season is 121.4 by Peyton Manning.
Now although I normally hate bad statistics, I’m willing to keep this around until something better comes along.
Pseudo-sabermetricans came a long and created the EPA (or expected points added). There isn’t a full definition of how this is created, or is it really explained. But if I ever figure it out I’ll be sure to comment on it.
Quarterback Value (QV)
This is a statistic I roughly created the other day. However, the data doesn’t present its self to show you a cool neat graph, instead it will be a hypothetical statistic until I get some more data or find a source of this information. There are three sections of this statistic. 1. Gained Points, and credits towards those 2.Expected Points loss. 3. Expected Score of Opponent
1. Gained Points
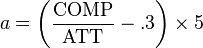
GP = 6 * [Passing Yards + Running yards that he ran - PTyards / Total Yards Gained]*[1 if TD] + 3*[% of Passing Yards]*[1 if within the NFL average Field Goal range for that stadium] + 6*[% of Running Yards in which he ran]*[1 if TD]
There are a few things to note here, I’ll work the equation from left to right. The 6 points is for the touchdown, if a team scores a touchdown, they get six, and it should be independent of the extra point attempt. The quarterback should be awarded the percentage of that in which he is solely responsible for, the passing yards. He should be given Points for driving down the field, and having a running back run the ball in. It was part of the quarterback that got the team down the field with his % of passing yards on that drive. The same applies to the third part of this equation, the Running Yards in which he ran. Some Quarterbacks are just at good at running the ball as throwing it, and they should be rewarded for that (well minus the injury risk). So they get the percent they helped the team make it down the field.
Now PT yards are penalty yards, a Quarterback should be penalized for actually committing a penalty. If he is bailed out by a running back, he should be awarded more than his share. So if he is given a penalty for Intentional Grounding, False Start or Delay of Game, than that should be subtracted from his total yards, because he put his team is danger, and forced them to have a harder time to score.
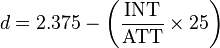
2. Expected Points Loss [EPL]
EPL = 6*[The times the team has scored 6 points / All the Times they were at this situation] + 3[The times the team has scored 3 / All the times they were at this situation] + 0 [ The times they didn’t score / all the times they were at this situation].
This is the true addition to this metric. The Expected Points Loss accounts for turnovers. I was watching a pre-season game when I thought, not all Interceptions and fumbles are created equal. There are two parts to a turnover, this portion of the statistic deals with the loss the quarterback inflicted on his team. This really works off of odds. Almost a “What would have happened if the Quarterback didn’t turn over the ball” Think about this as being 1st and goal, and the Quarterback throws an interception. Everyone this surely they would have scored had he not done that.
This is clearly a declining statistic. The farther you are away from your end zone, the less likely you are going to score, thus your team didn’t really lose that much from your turn over besides field position which in accounted for by the other half of this statistic.
3. Expected Score of Opponent [ESO]
ESO = 6*[The Probability of the other team scoring a touchdown]+3*[The Probability of the other team scoring a field goal]+6[If returned for touchdown].
Mistakes have consequences, and some mistakes are worse than others. The quarterback who fumbles the ball on his goal line, hands the ball over in the red zone, which the statistics are higher than if say he fumbled the ball at the opponents 1 yard line, where they would have to travel the length of the field to score. If the fumble or interception leads to a direct score, the quarterback should be penalized the full portion of the score.
Examples : (And Fake Numbers) |
This Game is where I will get some of the statistics
http://espn.go.com/nfl/boxscore?gameId=310206009
A rough estimate for the NFL’s expected points per yard is a negative slope of
Expected Points = 6.5 - .08125*Yards.
So allow us to begin.
The first scoring / turnover drive was with the Packers
Rodgers threw for 79% of the yards, so his + value will be 4.78
Ben Roethlisberger on the other hand threw an interception that was returned for a touchdown, so his – value would be -6
On his next Drive Roethlisberger drove the field either by running or passing and was involved for 100% of the drive, giving him +3 for the field goal. Updated score -3.
Unfortunately, he threw an interception, giving the packers the ball with 53 yards to go, costing him an opponent score of -2.45 bringing him back down to -5.45
Rodgers’s next drive he threw for 41/53 of the yards, gaining him 4.61 and moving his total points to 9.42
Roethlisberger then threw for 90% and earned a 5.37+ bringing him to .07
Roethlisberger then ran for 50% of the drive, giving him 3 points, and a total +2.93
Rodgers threw/ran for 81% of the next drive to get him 4.90 bringing him to 14.32
Roethlisberger then ran for 100% of the drive, giving him 6 points, and a total +8.93
Rodgers threw/ran for 80% of the next drive to get him 2.40 bringing him to +16.72
Thus by the end of the Game, Roethlisberger’s score was +8.93 and Rodgers was +16.72
Quarterback Value (QV)
This is a statistic I roughly created the other day. However, the data doesn’t present its self to show you a cool neat graph, instead it will be a hypothetical statistic until I get some more data or find a source of this information. There are three sections of this statistic. 1. Gained Points, and credits towards those 2.Expected Points loss. 3. Expected Score of Opponent
1. Gained Points
GP = 6 * [Passing Yards + Running yards that he ran - PTyards / Total Yards Gained]*[1 if TD] + 3*[% of Passing Yards]*[1 if within the NFL average Field Goal range for that stadium] + 6*[% of Running Yards in which he ran]*[1 if TD]
There are a few things to note here, I’ll work the equation from left to right. The 6 points is for the touchdown, if a team scores a touchdown, they get six, and it should be independent of the extra point attempt. The quarterback should be awarded the percentage of that in which he is solely responsible for, the passing yards. He should be given Points for driving down the field, and having a running back run the ball in. It was part of the quarterback that got the team down the field with his % of passing yards on that drive. The same applies to the third part of this equation, the Running Yards in which he ran. Some Quarterbacks are just at good at running the ball as throwing it, and they should be rewarded for that (well minus the injury risk). So they get the percent they helped the team make it down the field.
Now PT yards are penalty yards, a Quarterback should be penalized for actually committing a penalty. If he is bailed out by a running back, he should be awarded more than his share. So if he is given a penalty for Intentional Grounding, False Start or Delay of Game, than that should be subtracted from his total yards, because he put his team is danger, and forced them to have a harder time to score.
2. Expected Points Loss [EPL]
EPL = 6*[The times the team has scored 6 points / All the Times they were at this situation] + 3[The times the team has scored 3 / All the times they were at this situation] + 0 [ The times they didn’t score / all the times they were at this situation].
This is the true addition to this metric. The Expected Points Loss accounts for turnovers. I was watching a pre-season game when I thought, not all Interceptions and fumbles are created equal. There are two parts to a turnover, this portion of the statistic deals with the loss the quarterback inflicted on his team. This really works off of odds. Almost a “What would have happened if the Quarterback didn’t turn over the ball” Think about this as being 1st and goal, and the Quarterback throws an interception. Everyone this surely they would have scored had he not done that.
This is clearly a declining statistic. The farther you are away from your end zone, the less likely you are going to score, thus your team didn’t really lose that much from your turn over besides field position which in accounted for by the other half of this statistic.
3. Expected Score of Opponent [ESO]
ESO = 6*[The Probability of the other team scoring a touchdown]+3*[The Probability of the other team scoring a field goal]+6[If returned for touchdown].
Mistakes have consequences, and some mistakes are worse than others. The quarterback who fumbles the ball on his goal line, hands the ball over in the red zone, which the statistics are higher than if say he fumbled the ball at the opponents 1 yard line, where they would have to travel the length of the field to score. If the fumble or interception leads to a direct score, the quarterback should be penalized the full portion of the score.
Examples : (And Fake Numbers) |
This Game is where I will get some of the statistics
http://espn.go.com/nfl/boxscore?gameId=310206009
A rough estimate for the NFL’s expected points per yard is a negative slope of
Expected Points = 6.5 - .08125*Yards.
So allow us to begin.
The first scoring / turnover drive was with the Packers
Rodgers threw for 79% of the yards, so his + value will be 4.78
Ben Roethlisberger on the other hand threw an interception that was returned for a touchdown, so his – value would be -6
On his next Drive Roethlisberger drove the field either by running or passing and was involved for 100% of the drive, giving him +3 for the field goal. Updated score -3.
Unfortunately, he threw an interception, giving the packers the ball with 53 yards to go, costing him an opponent score of -2.45 bringing him back down to -5.45
Rodgers’s next drive he threw for 41/53 of the yards, gaining him 4.61 and moving his total points to 9.42
Roethlisberger then threw for 90% and earned a 5.37+ bringing him to .07
Roethlisberger then ran for 50% of the drive, giving him 3 points, and a total +2.93
Rodgers threw/ran for 81% of the next drive to get him 4.90 bringing him to 14.32
Roethlisberger then ran for 100% of the drive, giving him 6 points, and a total +8.93
Rodgers threw/ran for 80% of the next drive to get him 2.40 bringing him to +16.72
Thus by the end of the Game, Roethlisberger’s score was +8.93 and Rodgers was +16.72
The previous week, Mark Sanchez scored a +6.6
The expected opponents points was only used once because he ball was only turned over once, but you can see that if you are Mark Sanchez or Carson Palmer, your score would be much. Lower.
The expected opponents points was only used once because he ball was only turned over once, but you can see that if you are Mark Sanchez or Carson Palmer, your score would be much. Lower.
Monday, August 8, 2011
Why I hate European Football, and not why you think.
I HATE European football, and probably for all the wrong reasons. European football is one of the least stat-minded games. It is not because statistics are not present in the game, in fact the sport has an abundance of statistics, the problem is no one truly cares about them. Europeans believe that football is truly a team sport and statistics are useless. I argue the opposite, the only problem is, well... there arent records to demonstrate why statistics are important. Now by my previous statement, I imply their are hidden statistics in the game, but no team (or sports site) is recording this data. Below I break-down why this dumb, and some statistics I would suggest adding to the sport.
Money
The average English Premier League player makes £1,670,000 ($2,733,000.00). Think about making an investment that large and not looking into their performance.There are few companies that are willing to invest that kind of money based on "looks" rather than a statistically backed evidence. Most teams and scouts in modern sports quantify something about a player, because in the information age, we want data, not words. There isn't an EPL combine, or a Players skill test. The lost money is a shame to be honest. I am almost certain that you could walk into Liverpool,Chelsea,Man U and ask why is [insert expensive player] paid that much? Almost surely will they respond, his [unquantifiable] results on the pitch.

Stat-line
Before Sabermetricans, the baseball statistics had some logical use. The batting average (despite its emptiness) still made sense, if player X bats 100 times, we would expect him to hit 33 times. Here is the stat line for an average football player (imagine if they made soccer cards like they made baseball cards)
SH = Shot Total
SG = Shots on Goal
G = Goals
OF = Offsides
FD = Fouls Drawn
FC = Fouls Committed
SV = Saves
YC = Yellow Cards
RC = Red Cards
A seven year old- watching the game could have come up with those statistics. Come on people, we have advanced beyond that! Here is an average hockey stat-line (with sabermetric-esc stats)
GP = Games Played
G = Goals
A = Assist
PTS = Points
GC = Goals Created
+/- = Plus Minus
PIM = Penalties in Minute
EV = Even Strength Goals
PP = Power Play Goals
SH = Short Handed Goals
GW = Game Winning Goal
S = Shots
S% = Shooting Percentage
TOI = Time on Ice
ATOI = Average Time on Ice
OPS = Offensive Points Shared
DPS = Defensive Points Shared
PS = Points Shared
Now these are just the basic free statistics. Here would be just a few i would add to the stat-line of an average football player
TOP = Time on Pitch
P% = Passing Percentage
GA = Give Aways
TK = Take Aways
TOOS = Time on Opponents Side (Mainly for defenders)
BA = Breakaways
S% = Shooting Percentage
+/- = Plus Minus
FS = Forced Shots - A defensive player that forces a player to make a bad shot by angling them away from the goal
PG[E] = Penalties Given [Earned] - The earned portion is for a good reason, i.e a handball with five minutes left in and empty net aka. Luis Suarez's Handball
SP% = Set Play percentage. Now i admit, this is probably one of the weakest statistics, but it is a start. It is the percentage of set-plays where a team had the favouring result. As in it reached a member of his team, or a goal is scored.
ST% = Slide Tackle Percentage (Tackles won/ Total Slide Tackles)
T% = Tackle percentage (Tackles Won/ Tackles Taken)
Why I'm so mad:
The Reason it bugs me is that it appears as though no one cares! Not a single person states reasons why Fernando Torress has suffered over the past year. People use these Qualitative things like, He doesn't have form, he "lost his step". What does that even mean, sure i lose a step from time to time, but sadly I am not costing a team £50 million. No one mentions his Fouls Drawn have increased, showing a slower more desperate player, also his OF have increased over the past three seasons because he cant get his timing right. The biggest thing is his TOP,TOOS and shooting percentage are all down. This is what separates Soccer from really the rest of (American Sports). All major American team sports have some form of minors, whether its MLB, NFL (College),NBA (College),NHL(College/AHL). This hurts soccer. They have the "Reserves, or the Academy", but rarely do players advance from them. They rather pay a lot of money for a player that is "looking" good currently. Without statistics one can not project how well a person is going to do. Besides thinking that Fernando Torres was going to implode, we have little evidence to predict it.
Statistics are driven by data, and without data its tough to gauge what will occur. So for now, and probably for quite some time, there will be overpaid football players who look good, or lost their step, but one day a small Queens Park Rangers, or Bolton will find that group of players who learn to take a walk, or pass at a good ration. Until that day, I will continue to hate European football, and im sure they would say , it was for all the wrong reasons.
Subscribe to:
Comments (Atom)